When a critical process in your business goes down, it is essential you get it back up and running as quickly as possible. Unfortunately, before you can take action to diagnose and fix the problem, you need to find exactly when and where the problem occurred. In complex and distributed environments, it can be difficult to pinpoint the exact cause across hundreds or even thousands of interconnected systems and services.
Often, the only solution is to manually dig through thousands of lines of log files. This process can take hours just to find the problem—let alone fix it! These are hours you cannot afford to waste, considering downtime can cost companies up to $5,600 per minute due to lost customers, production delays, or reputational damage.
How can you reduce the amount of time and effort it takes to find (and then solve) these critical issues? Or even better, how can you identify these potential problems before they even happen? This is the promise of observability within the TIBCO® Platform.
Reduce time to resolution for mission-critical issues
The TIBCO Platform Control Plane provides a new end-to-end observability dashboard directly out-of-the-box so you can not only detect but also solve runtime and performance issues up to 60% faster.
The observability dashboard provides top-down views of key performance metrics like CPU usage, memory usage, application requests, EMS server messages, and more. With these top-down views, you can easily drill down to incidents at specific time stamps. From there, you can quickly view application details with already correlated logs and traces so you can follow requests from start to finish—reducing the time to identify problems from hours to just minutes.
Furthermore, not only can observability help you solve issues after they’ve accrued, but it also provides deep operational insights into your application architecture so you can optimize system performance and proactively prevent future issues.
Embrace open-source standards for observability
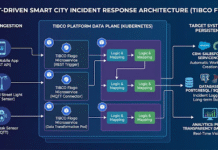
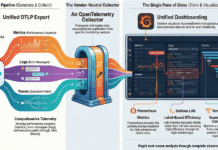
To enable observability, TIBCO uses the open-source standard, OpenTelemetry, to capture and export logs, traces, and metrics from your applications. Collection agents within user applications then gather logs, traces, and metrics, which are processed and enriched with Kubernetes-specific metadata before being exported to backend systems like Elasticsearch and Prometheus.
In addition to fueling our native observability dashboard, TIBCO provides the flexibility to extend this OpenTelemetry data to the third-party tool of your choice to support and supplement any existing observability initiatives.
End-to-end observability across your business
The TIBCO Platform observability dashboard provides complete end-to-end visibility across an evolving set of TIBCO capabilities—including TIBCO BusinessWorks™, TIBCO Flogo® Enterprise, and TIBCO Enterprise Message Service™—so you can reduce the risk of downtime to your business and optimize your system performance.
Watch our introductory webinar on the TIBCO Platform, including on-demand demos, to see the power of the platform firsthand.


