

TIBCO rolled out an update to the Spotfire Cloud offering in August and there were several new features added making it easier to use and get started with the Spotfire.
Introducing guest author, Bhupendra Patil. Bhupendra is a lead on the Spotfire Partner Team. He’s an expert on data analytics and has extensive experience delivering high-value solutions using all aspects of the Spotfire platform. He is also the author of the Spotfire Ideas Blog, which covers a wide range of technical topics.
In this post, he introduces us to the new mapping capabilities of Spotfire Cloud.
–Dave
Spotfire Business Author is a key part of the Spotfire Clooud offering and provides an analytics application right from your browser. It’s a zero foot print client (i.e. no add-ons or plugins required) and provides a secure and fast way to start analyzing your data from your favorite device.
With the latest release we’ve added two more chart types focusing on geo-analytics capabilities. We’ve introduced the ability to create Map Charts directly from the browser. All the mapping technology is powered by TIBCO, ensuring quality and scalability.
To access these new features, login to your cloud account on https://spotfire.cloud.tibco.com and launch Business Author by using the “Launch My Spotfire” link. You can then open an existing analysis or create a new one by uploading your own data.

If opening an existing analysis, you can switch to Business Author Mode by using the blue “edit” button. Authoring mode will give you the option of adding new visualizations.

You’ll notice the two new Map Charts are now available.
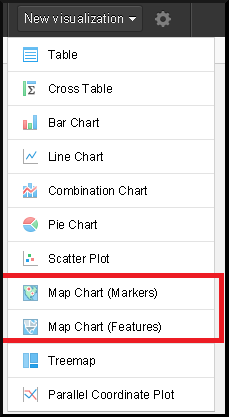
Map Chart (Features)
Map Chart with Features are great for showing Territory related data like States, Counties, Country level Data. Here is a map chart showing feature level data:

In this example, the dataset had a column with the State names and a column with our KPI value. Spotfire automatically recognizes the State column and adds the US feature layer. In this case it is also coloring each state according to our KPI. You can change the defaults or add additional customizations directly within your browser window. For example, if you have data at a different level, like Country , you can switch the “Feature by” easily from the visualization’s properties.
Map Chart (Markers)
Map Charts with Markers are great for charting precise locations. Latitude and longitude data can be used, or Spotfire’s built-in geocoding capabilities are available. Spotfire also offers a subscription-based web service for bulk address-level geocoding.
In the above example, we’ve set the location for retail stores and colored them by the nearest distribution center. The size of the markers represent the distance from the distribution center, and were automatically derived using Spotfire’s built-in “Great Circle” distance calcuation.
To see this dashboard incorporated into a full workflow, view this example which shows a supply chain optimization use case: http://spotfire.tibco.com/demos/supply-chain-optimization.


