A Spotfire analysis can be enhanced by using images to increase visual appeal and add additional contextual insight into your data.
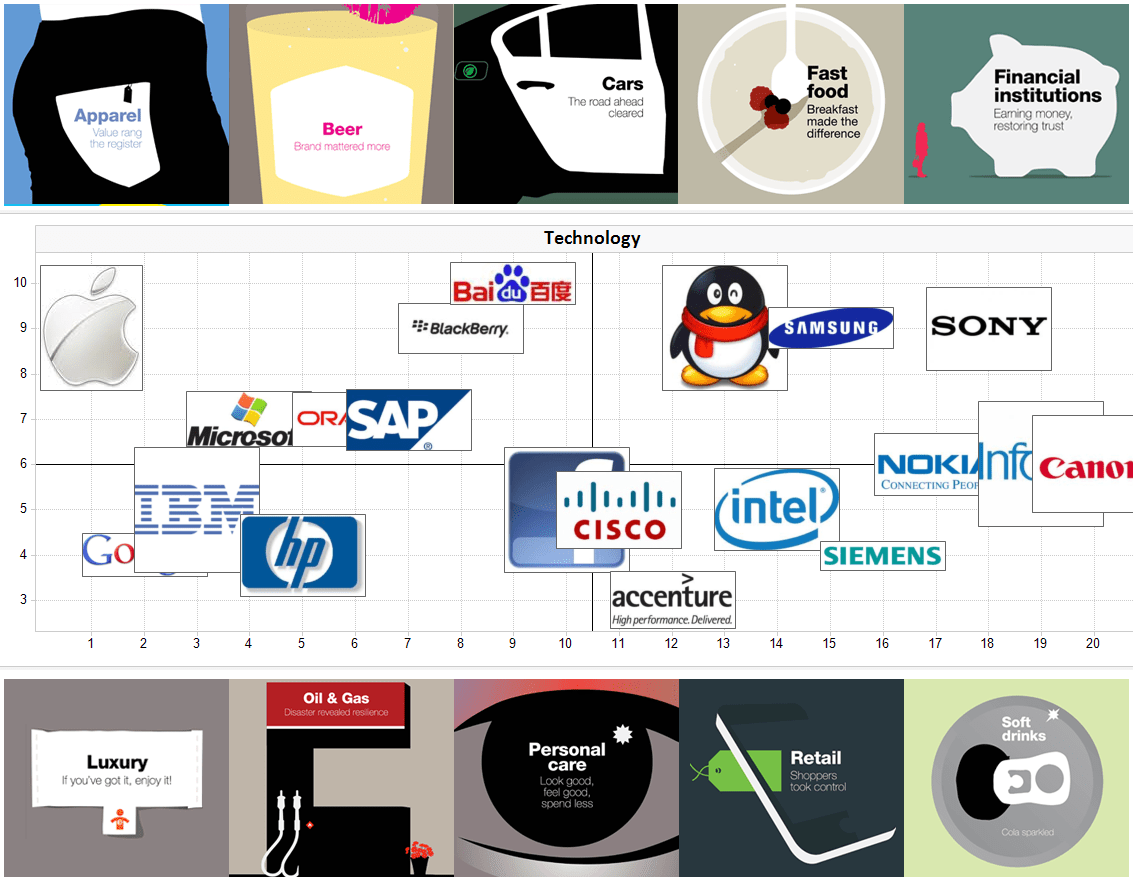
Above, a market tracking analysis is shown that uses images as navigation elements. The header and footer graphical elements are clickable, allowing the user to change the display of the plot. These were added directly in to Spotfire text areas to achieve a clean looking layout. The visualization itself uses images instead of markers to represent the category position on the plot.
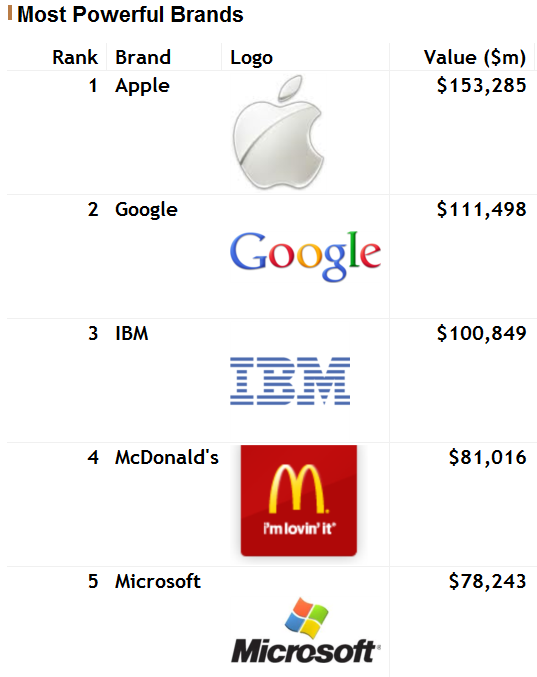
Here, we display a listing of top brands by corporate value, augmented with corporate logos:
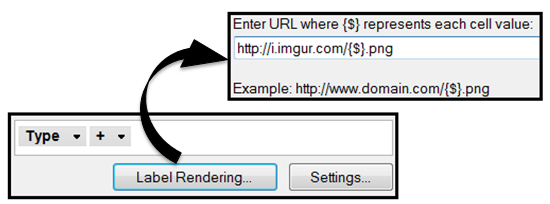
Images can be added to visualizations by using the Label Rendering option of your plot. A link will be generated to retrieve the image based on a defined link template – the placeholder in the template will be replaced with the value from the selected column:
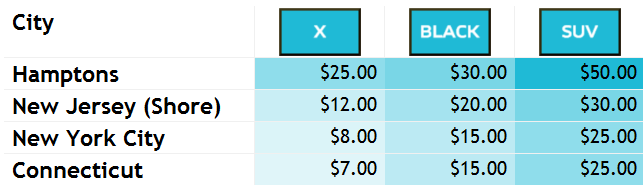
Images can also be used as axis labels on cross tables. The images remain clickable, allowing the user to maintain the dynamic sorting capabilities that cross-tables are great for. Here’s an example from an Uber Pricing Analysis: