

In the 80’s we thought 640k would be all the RAM we’d need, and that we’d be driving flying cars by now. Good thing we’ve got Spotfire’s two-click forecasting.
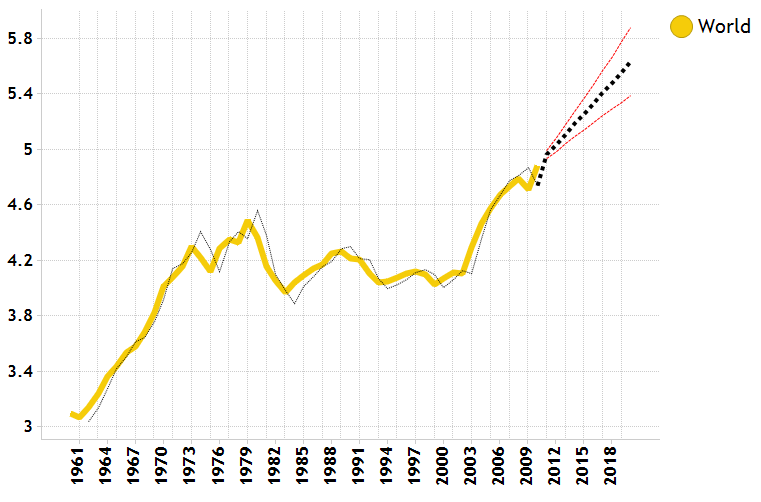
To apply a forecast to a time-series chart, simply right-click and select “forecast”. That’s it! The forecast is dynamic so it will automatically update based on how the data is filtered.
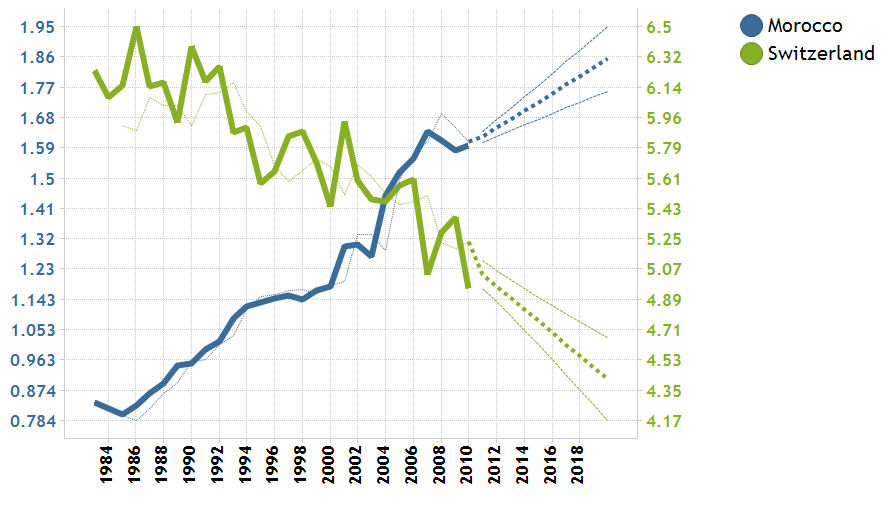
For line charts that show multiple trends, a forecast is applied for each so that the predictions can be easily compared.

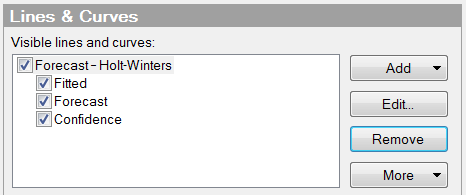
The forecast settings can be customized for greater control. It’s possible to adjust the confidence level, as well as how far into the future the forecast should display. The trend is based on the Holt-Winters forecast method. For a more in depth look at forecasting with Holt-Winters, visit this QRT (Quick Reference Topic).
For incorporating your own forecast model, it’s also easy to call models written in R, S+, SAS or other statistical packages using Spotfire’s data function capability. More assistance with incorporating your own model can be found on the Spotfire Learning Network, click here.


