

It is a buyer’s market—and consumer pressure is forcing analytics vendors to up their game and produce easy-to-use analytic solutions for a diverse range of use cases. Business users want ease of use, and analytics aficionados (analysts, data scientists) want ease of use, power, flexibility, functionality, control, and breadth to create dashboards and guided analytics for those who lack the time, inclination, or skill to do it themselves.
Set upon a single, unified platform, TIBCO Spotfire empowers all users, regardless of skill level, to blend, prep, analyze, and optimize data sets without sacrificing governance, scale, or self-service. Here’s how:
Recommendations
The Spotfire Recommendations feature, one of the strongest features in TIBCO’s analytic toolbox, profiles the characteristics of your data, then automatically suggests visualizations that best fit the data set. Recommendations surveys and logs a number of characteristics, including column value counts, data types, values, and hierarchical relationships among columns.
After clicking the Recommendations icon and selecting your data set, users are presented with a gallery of possible visualizations, then choose the ones that suit their needs. Users do not have to load data files and drag datasets into columns. Once the user chooses a visualization, Spotfire renders it and allows the user to further customize or start instantly analyzing their data to find “aha! moments.”
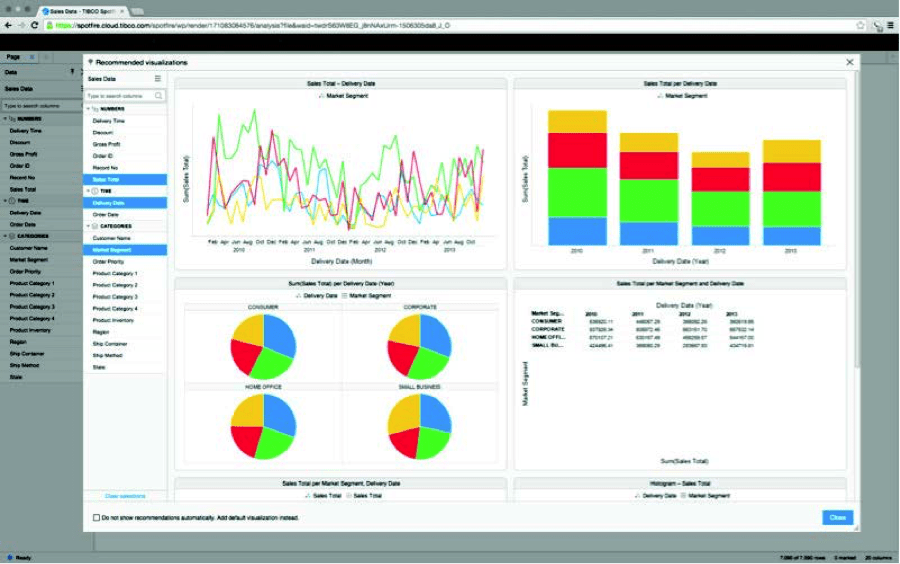 The Recommendations engine suggests visualizations based on a user’s data set. The user then selects one or more visualizations that best represents their data, and can customize it to showcase relevant data points for their analysis.
The Next Step – Using History to Forecast the Future
Beyond using analytics to analyze historical data sets, users can create visualizations to anticipate a variety of what-if and what-will-be scenarios. Also known as predictive analytics, forecasting future trends or events based on historical datasets gives decision makers the ability to anticipate things like purchase behavior, the likelihood of equipment failure, or customers most likely to churn. Predictive analytics helps business users:
- Improve decision-making by discovering data patterns and trends
- Anticipate and react to emerging trends
- Manage risk through scenario planning, forecasting, and fraud detection
- Anticipate behavior and corrective take action.
Integrate Predictive Analytics Into Your Environment
Spotfire predictive analytics tools are easily implemented in one of three ways, using:
- TIBCO Enterprise Runtime for R (TERR), a production-class environment that runs R scripts and packages. TERR combines the agility of open source R with the speed and reliability of an enterprise platform—personnel can run analytic models written in R, quickly moving them from prototyping to production without rewriting or porting code
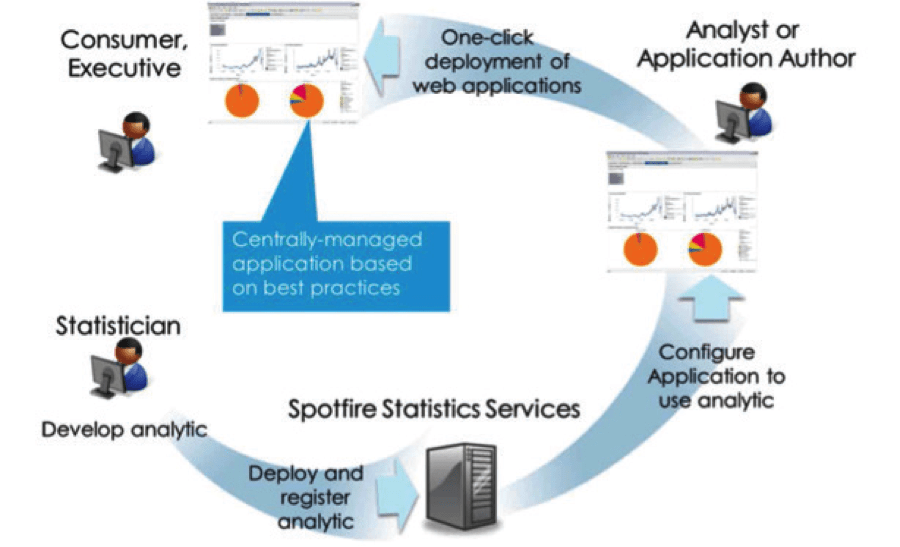
- TIBCO Spotfire Statistics Services, a predictive analytics ecosystem for the integration of legacy analytic tools with Spotfire applications
- Visual modeling tools provide predictive insights without statistical programming
If you’d like to learn more about how to empower everyone in your organization with powerful, easy-to-use analytics, read: Empowering the Masses with Analytics.
Learn more about Spotfire and the TIBCO Fast Data platform.


