

In today’s environment, it is imperative for oil and gas firms to generate insights from their data from production operations, refining operations, distribution, and sales operations, and use them towards gaining a competitive advantage for their business.
At TIBCO’s sold-out Energy Forum (#TIBCOEF15) in Houston on September 1-2, 2015, nearly 500 customers were present and shared their excitement and success stories about how TIBCO Spotfire drives data analytics-based decision-making in their organizations.
Here are some of the learnings we found about how Spotfire customers are using Spotfire and its visual data analytics capabilities in the oil and gas business.
Revenue & Margin Analysis
An important aspect in running a business is doing analyses on revenue and all the elements that constitute revenue: price, quantity, and product mix. One company shared how it uses Spotfire to drill down into revenue changes by geographical area, product line, sub-product line, and customer. They were able to examine the effect of price changes on billed revenue on a weekly, monthly, and quarterly time scale. This allowed them to make strategic decision to optimize revenue performance.
The company was also able to analyze customer pricing levels and compare customers to their peers with a similar product mix to identify pricing opportunities that could allow generation of more revenue.

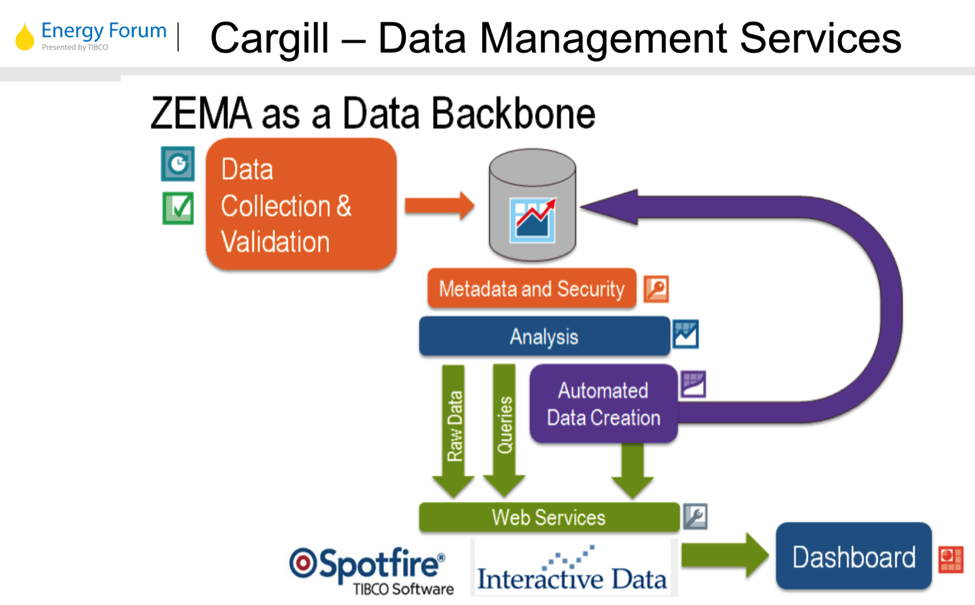
In another presentation, Cargill shared their Analytical Framework Roadmap around technology and operational models for analytics. It consists of ZEMA system for data collection and validation, and Spotfire to build predictive models and interactive dashboards.
The possibilities for using data for improving operations and gaining a competitive edge are endless. This was also confirmed in a presentation by Ruths.ai, a data science consulting firm which focuses on solving routine and strategic problems using data that customers already have. Many companies struggle with data sitting in disparate systems and not being utilized for decision-making. An example given by another customer involved building a probit plot template in Spotfire to do probit analysis utilizing different data sources. Their existing tool in Excel was limited to five columns of data and 100,000 records at a time. Through the Spotfire template, they were able to swap out data tables with minimal manipulation. They also took advantage of TIBCO Enterprise Runtime for R (TERR) within Spotfire for easily swapping out measures and dimensions.


