

The Department of Housing and Urban Development (HUD) collects data on homelessness from the US and releases two annual reports to Congress called the Annual Homelessness Assessment Report (AHAR), Parts 1 and 2. Part 1 contains information from the annual Point-in-Time Counts (PIT) conducted by communities nationwide on a single night in January. Part 2 includes information obtained from homeless shelters throughout the course of an calendar year—the Homeless Inventory Count (HIC).
Raw data is available online at data.hud.gov. We obtained PIT and HIC data for 2007-2013 as part of a bake-off with Qlikview, Tableau, and SAS at the annual Gartner BI conference in Las Vegas. The HIC and PIT data are yearly measures across 473 spatial regions in the US—CoCs (Continuums of Care). Estimates of homeless veterans are included beginning in 2011. HUD partners with the VA on the Veterans Homelessness Prevention Demonstration Program.
Our analysis of the homelessness data is publicly available on Spotfire Cloud.
This analysis shows that from 2007 to 2013 homeless rates and bed utilization have dropped across the US. In 2013, the average bed utilization across the US was approximately 84%. However, there are still many states and regions that have high homeless rates and high bed utilization.
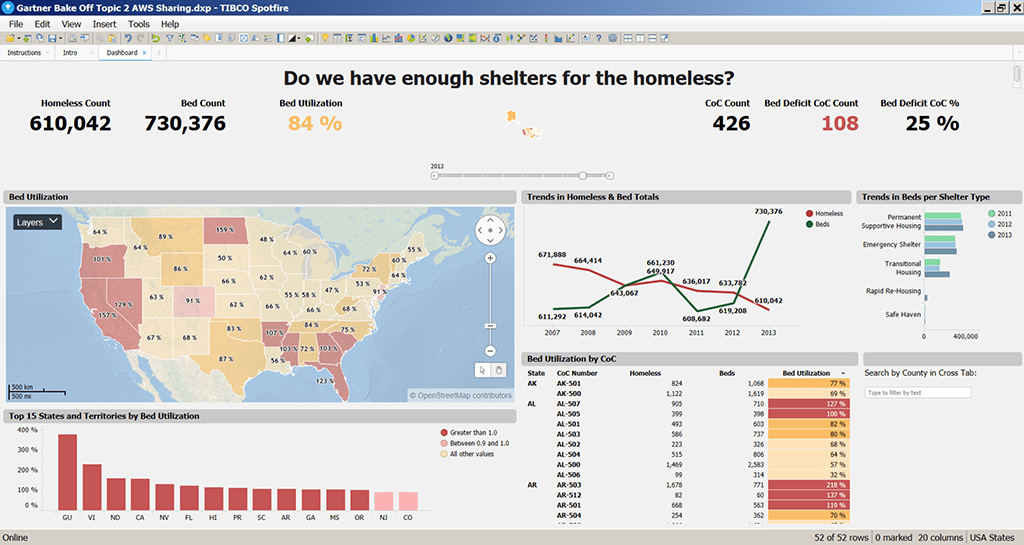
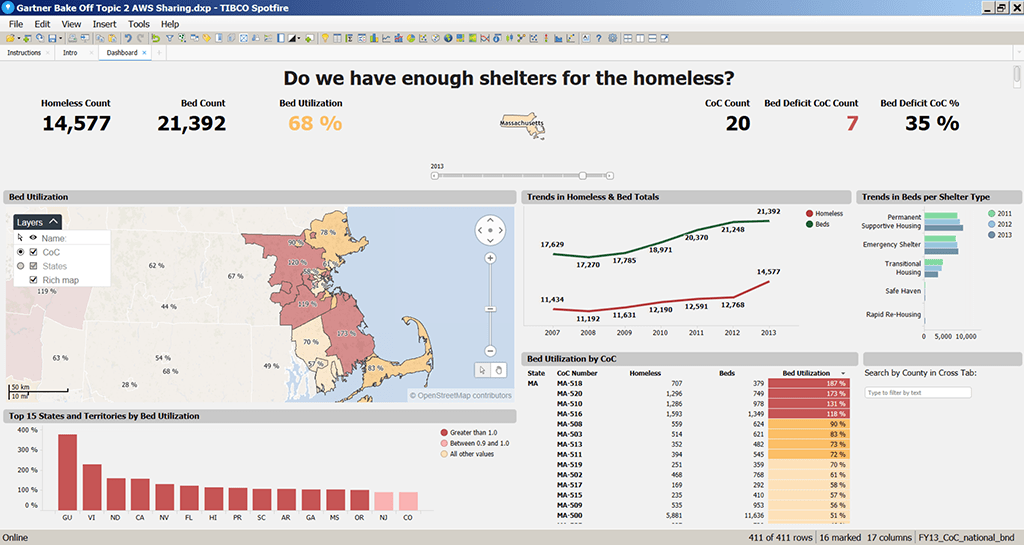
Our analysis shows the hot spots of homelessness and high bed utilization—and shows how Spotfire can identify these hotspots on a rolling basis via scheduled analysis and reporting. We also show how the homeless can be routed from one region to another in order to provide services (e.g. at shelters with available beds and at facilities such as VA Hospitals for our homeless veterans). See Figure 3 below:

This pattern indicates some homeless migration to warmer regions and can depend on prevailing climate. See Figure 4 for contour analysis of temperature and precipitation. Redder indicates warmer temperature and circle size shows amount of precipitation:

The TIBCO Fast Data platform can trigger these analyses automatically, and via notifications and alerts, can help the homeless population obtain shelters and services from existing capacity in the system.


