

Increasingly, data and analytics are being used to improve the quality of life for citizens around the world.
For example, in September the United Nations’ Global Pulse project and the Secretary General’s Climate Change Support Team will be hosting the Big Data Climate Challenge, a competition to encourage the use of big data to solve global problems related to climate change.
The UN Global Pulse is seeking climate-related projects and initiatives that use big data and analytics to show the economic impacts of climate change and ways to deal with those impacts.
A British water utility is using data visualization to help conserve water by bringing operational data about metering, water flows, pump efficiencies and leaks to life.
Previously, this information was shared throughout the utility using long, data-heavy tables. Using data visualization techniques, engineers for the utility can now see potential problems and share information with senior management about those problems.
With these types of visualization capabilities, engineers for the water company can more clearly communicate the nature of an operational problem, which ultimately leads to swifter, more informed decision-making.
Data visualization also opens up new opportunities for business leaders to identify new questions to pose in the decision-making process that they may not have even considered.
For instance, Scotland’s Environment Web (SEWeb) is using TIBCO Spotfire analytics to enable residents to learn more about Scotland’s environment so they can help improve it. The SEWeb is jointly funded by the European Union’s LIFE+ program and the Scottish Environment Protection Agency with input and support from a number of partners.
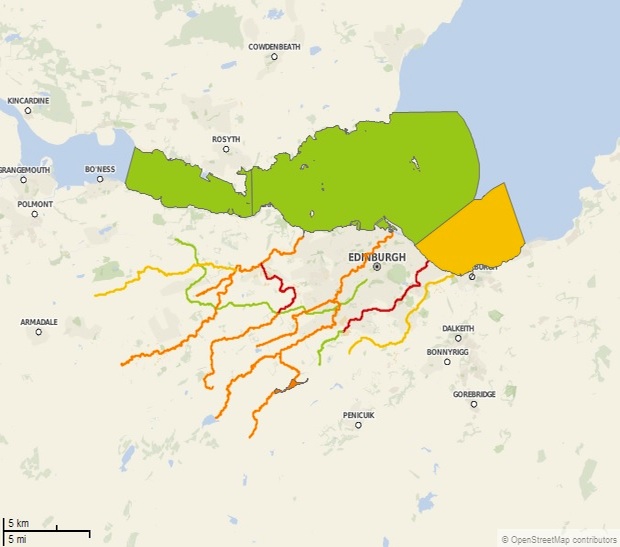
The SEWeb lets Scottish residents and visitors use TIBCO Spotfire’s data visualization tools to visualize information about Scotland’s environment and interact with the data considerably more deeply than they could with books or by viewing the information on screens.
SEWeb users can analyze and view multiple layers of data about the environment, enabling them to filter data based on their areas of interest (i.e., air, water, ground).
The data visualization tools save users time and effort because they don’t have to trawl through detailed reports to find the pertinent information. Plus, the tools make the environmental information that interests them most more visible, allowing users to absorb information faster and more completely.
Next Steps:
- Try Spotfire and start discovering meaningful insights in your own data.
- Subscribe to our blog to stay up to date on the latest insights and trends in big data and big data analytics.


