
By utilizing the ‘Column Matches’ feature, which was introduced in version 5.5, you can visualize data from different data tables in one plot. Previously, two Data Tables could exist independently of one another and could be related using the Data Relations feature, but if you wanted to visualize the data in a single Visualization in Spotfire, the data needed to come from a single Data Table.
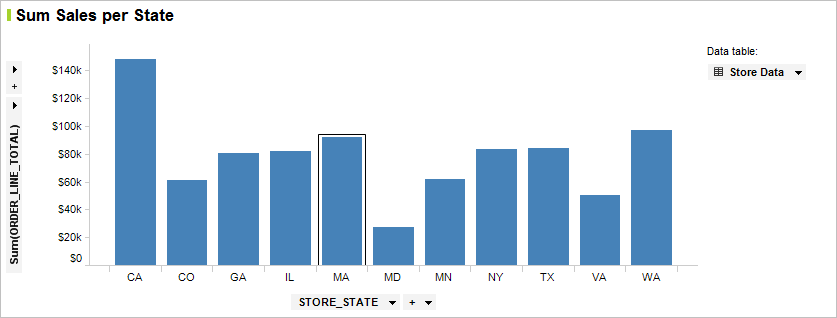
Let’s take a look at an example. Assume we have a Data Table of sales transactions.

We may want to plot this on a Bar Chart or Combination Chart to show the Sum of Sales across each State.
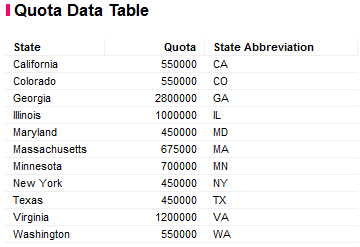
Suppose we have another Data Table that contains the yearly forecast or quota for each state. The store chain only has stores in 11 of the 50 states in US, but have over a hundred thousand rows of transactional sales data. It does not really make sense to join the quota column with the original Data Table for this reason (many rows will have duplicate values).
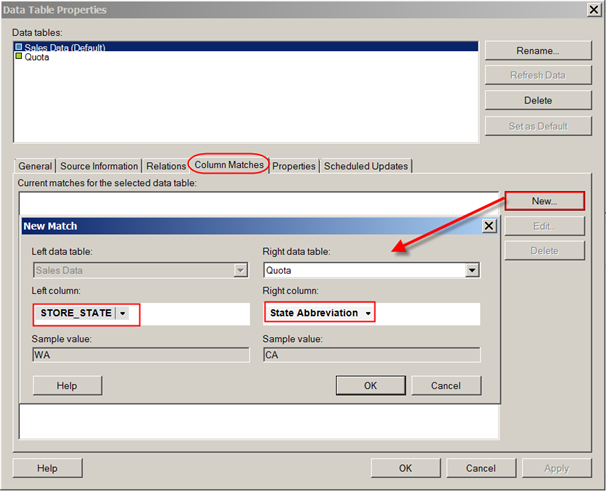
If the two Data Tables have Columns with the same name, a ‘Column Match’ will automatically be created. You can see this under the Data Table Properties dialog. If there are Columns you want to match, but don’t have the same name, you should go to the ‘Column Matches’ tab.
In this example, you will match up the ‘STORE_STATE’ Column from the ‘Sales Data’ Table with the ‘State Abbreviation’ Column from the ‘Quota’ Data Table.
Then, from within the Combination Chart, you can go to the Value Axis and add an additional Column. You will see a dialog which allows you to select the Data Table. In this case, we will select the ‘Quota’ Data Table and then the expression ‘Sum([Quota])’.

In the resulting Combination Chart, we can show the quota as a line and keep the sales total as a bar.

Now let’s assume we want to create another Bar Chart which shows the percentage of quota for each state. Using the new matching feature you are able to create an expression using both Data Tables.
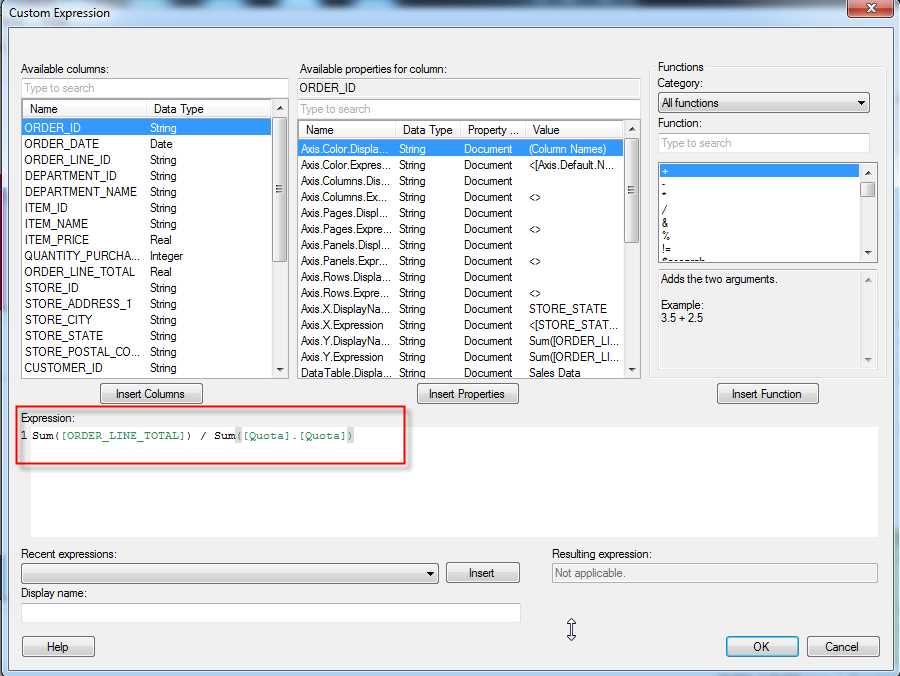
The expression used is :
Sum([ORDER_LINE_TOTAL]) / Sum([Quota].[Quota])
In this case, the ‘Sales Data’ Data Table is the master Data Table for the Visualization, so the expression does not need to refer to it when reference its Columns (i.e. Sum([ORDER_LINE_TOTAL)). However, when referencing the ‘Quota’ Column, we need to reference the ‘Quota’ Data Table as well, using the following syntax:
[Data Table Name].[Column Name]
NOTE: You cannot use multiple Data Tables in a single aggregation (ie. Sum([T1.Sales] + [T2.Quota])


