Transitioning to TIBCO BusinessEvents 6.4: How to unify logs, metrics, and traces?
The release of TIBCO Platform Event Processing – BusinessEvents (BE) 6.4 in January 2026 marks a critical evolution in the management of Contextual Event Processing (CEP) environments. Transitioning from proprietary monitoring silos to a standardized observability model by adopting the OpenTelemetry Protocol (OTLP).
Organizations can now move beyond “black box” execution and achieve deep visibility into the internal logic of the engine, resolving the fragmentation that occurs when logs, metrics, and traces are trapped in disparate, vendor-specific formats.
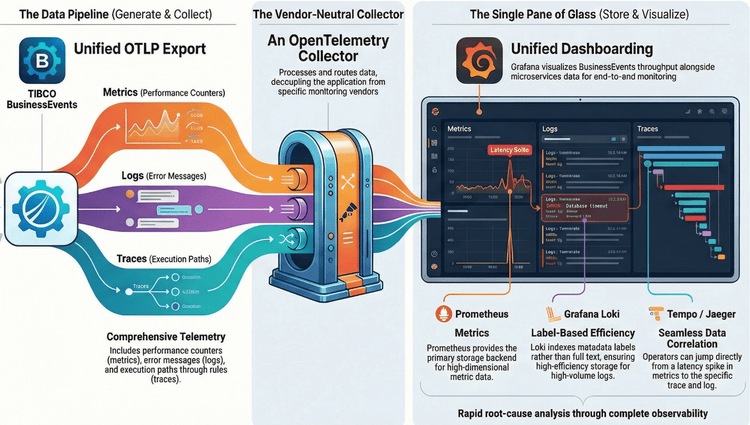
Here is a view of the end-to-end pipeline of the unified observability framework for TIBCO BusinessEvents.
In this flow, the three components – Exporter, Collector, and Visualizer- form a decoupled architecture.
The robust telemetry pipeline capable of managing high-volume data streams integrated with the OpenTelemetry Collector that enables unified dashboarding for deeper and meaningful insights of metrics, logs, and traces from BusinessEvents applications.
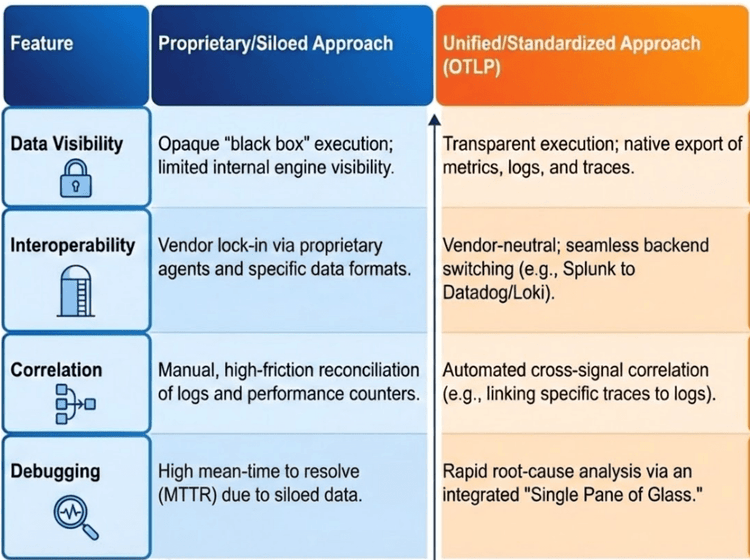
The following compares the traditional approach with the Unified Observability model introduced in version 6.4:
The shift toward open standards is underpinned by several Strategic Value Drivers:
- Vendor Neutrality: Decoupling application telemetry from the backend provider allows for dynamic architectural adjustments and long-term cost optimization.
- Cross-Signal Correlation: Bridging the gap between disparate signals provides a holistic narrative of system behavior that isolated tools cannot replicate.
Operational Agility: Utilizing a unified protocol reduces the technical debt associated with maintaining multiple proprietary collectors and agents.
The Observability Pipeline Flow
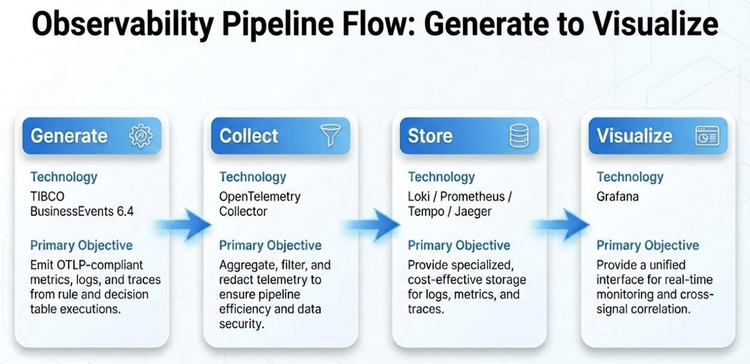
At a high level, the pipeline has four steps starting from Generate, Collect, Store, and Visualize. Let us understand each of these steps.
Step 1: Generate – TIBCO BusinessEvents
The event processing engine, powered by TIBCO BusinessEvents, emits OTLP-compliant data from rules and decision tables execution.
The following are three specialized telemetry types essential for production oversight:
- Metrics: Captures real-time performance counters, resource utilization (CPU/Memory), and throughput statistics to monitor general system health and scaling triggers.
- Logs: Provides human-readable application logs and error messages, offering the necessary context for specific system exceptions.
- Traces: Maps the detailed execution paths of an event as it traverses through rules and decision tables, pinpointing logic bottlenecks and processing delays.
Step 2: Collect – The OpenTelemetry Collector
The OpenTelemetry (OTel) Collector functions as a vendor-neutral proxy that decouples the TIBCO BusinessEvents engine from backend storage.
This decoupling is strategic, as it allows architects to modify data routing and transformation logic without touching the core application code.
In a production environment, the Collector ensures that the high-frequency event data generated by the BE engine is handled with the appropriate scale and security before reaching the persistence layer.
The Collector manages the telemetry data generated by BusinessEvents through a rigorous “Receive-Process-Export” lifecycle:
- Receive: The Collector ingests data via OTLP receivers directly from the BusinessEvents instances.
- Process: This is the most critical phase for architectural efficiency. The Collector performs batching to optimize network throughput, filtering to eliminate telemetry noise, and redacting to ensure PII or sensitive business data is stripped before egress.
- Export: Finally, the Collector dispatches the sanitized data to specialized backends like Loki, Prometheus, or Tempo/Jaeger.
By filtering and redacting noise at the Collector level, architects significantly reduce the ingest load and storage costs on downstream systems, which is particularly vital for the high-volume log storage requirements of event-driven architecture.
Step 3: Store – The Loki Efficient Storage Model
Traditional full-text indexing strategies frequently collapse under the pressure of high-volume event processing, where the sheer scale of log data makes indexing every word prohibitively expensive and slow.
This framework adopts Grafana Loki, a log aggregation system designed as “Prometheus for logs.” Unlike traditional tools, Loki avoids the overhead of full-text indexing by focusing on metadata-driven indexing.
The efficiency of this model stems from indexing only the labels (metadata) associated with a log stream rather than the raw message content. This results in:
- Enhanced Cost-Effectiveness: Drastic reductions in storage and compute requirements for log retention.
- High-Speed Query Performance: By leveraging the same label-based selection logic as Prometheus, Loki can quickly isolate relevant log streams from massive datasets during an investigation.
Integration is achieved via the OTel Collector’s otlphttp exporter. During this process, the Collector transforms OTel “Resource Attributes” into structured Loki labels to preserve environmental context. Critical mapped attributes include:
- service.name: Identifies the specific BusinessEvents application or microservice.
- k8s.pod.name: Provides the specific Kubernetes pod/container context for infrastructure-level troubleshooting.
- deployment.environment: Distinguishes between production, staging, and development streams to prevent cross-environment data contamination.
While these optimized logs provide the forensic detail required for an investigation, they only offer maximum value when synthesized with metrics and traces within a unified visualization layer.
Step 4: Visualize – The “Single Pane of Glass” in Grafana
Grafana serves as the central intelligence layer, providing the “Single Pane of Glass” necessary to monitor complex CEP ecosystems. Its strategic value lies in its ability to unify disparate data sources—Prometheus for metrics, Loki for logs, and Tempo or Jaeger for traces—into a single operational view, eliminating the cognitive load of context-switching between tools during a crisis.
The framework’s core advantage is the “Correlation Workflow,” which enables technical teams to navigate the observability “three pillars” seamlessly:
- Metrics to Traces: When a dashboard identifies a latency spike in a rule execution metric, Grafana queries the backend using Exemplars—specific trace IDs recorded alongside metric samples—to link the performance dip directly to a transaction trace.
- Traces to Logs: While inspecting a trace in the Tempo/Jaeger UI, the operator can pivot directly to the exact log lines in Loki. This is possible because the trace_id is embedded in the log metadata, allowing the operator to see the engine’s internal narrative at the exact millisecond a rule was fired.
Effective Unified Dashboards must be designed for immediate situational awareness by displaying the following components side-by-side:
- Real-time Throughput & Latency: To detect anomalies in rule processing speeds.
- Log Error Rates per Service: To correlate software exceptions with performance degradation.
- Active Rule Execution Traces: To provide a visual representation of how events are moving through the decision logic.
These technical capabilities transform telemetry into an actionable operational methodology for rapid incident response.
Use Case: Operational Workflow for Rapid Root-Cause Analysis
Root-Cause Analysis requires transforming the raw telemetry data into a structured methodology for rapid incident response in high-volume production environments. By standardizing how data is generated and linked, the framework minimizes the “detect-to-resolve” window.
Linking rule execution traces to specific log lines is the most effective way to reduce Mean Time to Resolution (MTTR). To ensure this correlation remains functional during high-traffic events, engineers must adhere to the following Architect’s Checklist:
- Validate Trace ID Injection: Audit the BusinessEvents engine configuration to ensure the trace_id is explicitly injected into every application log line.
- Audit Label Consistency: Verify that the OTel Collector is correctly mapping service.name and other Resource Attributes to Loki labels to prevent context loss.
- Enable Metric Exemplars: Ensure the Prometheus storage layer is configured to store and serve exemplars, allowing for the critical jump from metrics to traces in Grafana.
With the implementation of this OTLP-based architecture, enterprises gain a scalable, flexible observability foundation that ensures high-volume event processing remains transparent, manageable, and resilient to the complexities of modern digital operations.